
Publish Date: September 2026
Updated Tariff & Recession Risk Analysis and Forecasts
The 2026 Plastic & Rubber Products Manufacturing Market Report covers the $299.9 billion industry which transforms synthetic polymers and elastomers into diverse components and products spanning virtually every sector of the economy. Competitive structure includes large diversified manufacturers alongside specialized producers focused on particular conversion technologies or market segments. Market demands increasingly emphasize performance durability, design flexibility, weight reduction, and increasingly sustainable material composition addressing growing environmental concerns. Manufacturers face challenges balancing processing technology requirements, tooling investments, material engineering, and tariff considerations affecting both polymer/elastomer imports and international market access. Successful companies establish advantages through advanced processing technologies creating enhanced properties, specialized manufacturing capabilities addressing complex requirements, innovative design features optimizing performance, and increasingly circular economy initiatives incorporating recycled content in a sector where both technical capabilities and environmental credentials increasingly determine competitive positioning across diverse plastic and rubber product categories.


Plastic & Rubber Products Manufacturing Industry Description
Plastic & Rubber Products Manufacturing transforms polymer resins, rubbers, and compounds into finished products through molding, extrusion, compression, and fabrication processes. Companies shape thermoplastic and thermosetting materials into components and finished goods with precise dimensions and performance characteristics. These businesses serve virtually every sector with products ranging from simple packaging to complex engineered components. The industry represents the crucial conversion stage where polymer materials become useful products, with operations spanning high-volume automated production to specialized custom manufacturing, increasingly focusing on lightweight designs, recycled content, and sustainable materials that maintain performance while addressing environmental concerns.
NAICS Code: 326
Number of Companies: 8,989
Number of Plants / Facilities: 11,907
Total Employees: 782,428
Market Size: $299.9 billion
TARIFF IMPACT (Summer 2025 – Download Report for Updated Analysis)
This report has in-depth analysis on the recent US tariff changes on material costs, quantifying import dependencies, tariff exposure rates, and key source countries for the plastic & rubber products manufacturing sector.
Estimated Tariff Cost: $14 billion
Relative Tariff Impact: VERY HIGH
Plastic & Rubber Products Manufacturing Report Format
The 2026 U.S. Plastic & Rubber Products Manufacturing Market Report is 63 pages of deep insights into the trends, dynamics, and forecasts shaping the industry. This market report is utilized by professionals to gain a in-depth understanding of the sector for business strategy, planning, forecasting, benchmarking, industry analysis, valuations, identifying organizational inefficiencies, financial analysis, and more.
The report has over 100 industry statistical data sets with historicals (2017-2025), trend analysis, and forecasts for 2026 and the next 5 years. The report includes sales & expense trends, 26 expense categories, extensive financial analysis, forecasts on 100+ data sets, inventory trends & analysis, detailed breakdown of 31 balance sheet items, numerous industry segmentations, industry concentration analysis, production material costs, profitability metrics, state metrics analysis, plant productivity benchmarks, employee role analysis, 4 years of inflation analysis, compensation analysis, employee productivity benchmarks, and more.
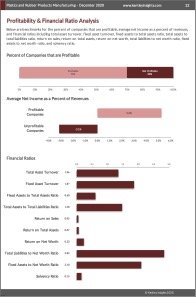
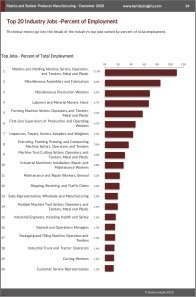
Below are a few page images from the report and check out the table of contents for a complete overview.




Report Table of Contents
Review the table of contents to understand the extensive statistical data sets in this report and why thousands of executives, consultants, bankers, accountants, and other professionals trust Kentley Insights for their market research needs.
The data source for the report is extensive annual expense, revenue, wage, operational, and economic surveys administered by federal and private institutions and filled out by a majority of companies in the plastic & rubber products manufacturing sector. Our analysts develop the forecasts utilizing econometric models based on historical statistical analysis, industry trends and dynamics, macroeconomic analysis & forecasts.
1-2 – Market Report Overview & Contents
3 – Market Overview
– Data Sources & Methodology
– Sector Definition & Examples
– Market Commentary
4 – Report Synopsis – Revenue & Growth
5 – Report Synopsis – Costs & Profitability
SECTION ONE
REVENUE & GROWTH
7 – Market Size Details
– Industry Revenues, Companies, & Facilities
– Analysis 2017-2025
– 2026 & 2030 Forecasts
8 – Growth Benchmarks
– Sales per Company and Plant
– Analysis 2017-2025
– 2026 & 2030 Forecasts
9 – Product Lines Revenue
10 – BCG Matrix – Income vs. Revenue Growth
11 – Total Industry Sales by Month & Year (2021-2025)
12 – Inventory Value by Month & Year (2021-2025)
13 – Months of Inventory (2021-2025)
14 – Sector Revenue by Segments
– Business Concentration, Size, & Structure
15 – Market Size by State
– Market Size and Rankings
16 – Market Size as a % of State GDP
17 – Sales as a % of State Manufacturing
18 – Market Segmentation by Business Size
19 – Market Segmentation by Business Size
– Business Size Segments – 1-4, 5-9, 10-20, 21-50, 51-100, 101-250, & 250+ employees
– Companies, Facilities, Sales, Employees & Payroll
20 – Segmentation by Concentration (Top 50 Companies)
– Concentration Segments – Top 4, 5-8, 9-20, & 21-50 companies
– Companies, Facilities, Sales, Employees & Payroll
21 – Market Share of Top 50 Companies
22 – Subsector Market Share of Top 50 Companies
23 – Segmentation by Business Structure
– Business Structure Segments – C-Corporations, S-Corporations, Partnerships, & Sole Proprietorships
– Companies, Facilities, Sales, Employees & Payroll
24 – Revenue per Company by State
25 – Revenue per Company by Segments
26 – Revenue per Facility by State
27 – Revenue per Facility by Segment
28 – Subsector Market Size & Growth
29 – Subsector Sales per Company & Plant
30 – 5-Year Consolidation Analysis
31 – Employment Consolidation Analysis
32 – Subsector Consolidation Analysis
– Number of Companies & Facilities
33 – Subsector Consolidation Analysis
– Facilities & Employees per Company
COST, CAPITAL & FINANCIALS
35 – Profitability & Financial Ratio Analysis
Page 36 – Balance Sheet Metrics
– Assets and Liabilities indexed to industry revenue at 100
– 16 Current & Non-Current Assets Categories
– 15 Short-term, Long-term Liabilities, & Net Worth
37 – OPEX
– Industry OPEX Analysis
– 2017-2025 Trends, 2026 & 2030 Forecasts
38 – OPEX by Company & Plant
– OPEX per Company & Plant
– 2017-2025 Trends, 2026 & 2030 Forecasts
Page 39 – OPEX Detail
– 6 Employee Expense Categories
– 8 Cost of Material Categories
– 6 Buildings and Equipment Categories
– 8 Other Operating Expense Categories
-Inventory Breakdown: finished goods, work-in-progress, materials and supplies
40 – Production Material Costs & Tariff Analysis
– Top Production Material Costs Breakdown
– Industry & Material Tariff Analysis – % of costs, import %, tariff costs, source countries
41 – Producer Pricing Index
– 2017-2025 Trends, 2026 & 2030 Forecasts
– Monthly PPI Figures for the Past 4 Years
42 – Plant Utilization & Hours
– Plant Utilization Rate
– Plant Operational Hours per Week
– 2022-2025 Historical Figures by Quarter
43 – Reasons for Non-Full Production
– 7 Categories Quarterly Survey Results for Past 2 Years
44 – Productivity & Employment
– Revenue per Employee
– Total Number of Employees
– Employees per Company
– 2017-2025 Trends, 2026 & 2030 Forecasts
45 – Employee Productivity by Segments
46 – Employee Productivity by State
47 –Subsector Sales & Payroll per Employee
48 – Payroll
– Payroll per Employee, Company, & Plant
– 2017-2025 Trends, 2026 & 2030 Forecasts
49 – Payroll per Company by Segments
50 – Payroll per Plant by Segments
51 – Payroll per Employee by Segments
52 – Payroll per Employee by State
53 – Employee Composition
– % of Employees for 27 Job Categories
54 – Job Categorization Pay Ranges
– Pay Bands – Bottom 10% & 25%, Mean, Top 25% & 10%
55 – Top 20 Jobs Breakdown
56 – Top 20 Jobs Pay
– Pay Bands
57 – Employees per Company by Segments
58 – Employees per Plant by Segments
59 – Facilities per Company by Segments
60 – Total Employment by State
61 – Population to Every Employee by State
62 – Employees per Facility by State
63 – Overview of Kentley Insights
Download a Sample Report
Below is a free sample report download. The 2026 Plastic & Rubber Products Manufacturing Market Report has the same layout and data sets as the sample report.

Product Lines, Materials, and Jobs Covered in Report
PRODUCT LINES
Plastics product manufacturing
Rubber product manufacturing
MATERIAL COST CATEGORIES
Materials, ingredients, containers, and supplies, nsk
Thermoplastic and thermosetting resins and plastics materials
Cost of all other materials and components, parts, containers, and supplies consumed
Plastics products (including packaging, foam products, film, sheet, rod, tube, fabricated shapes, bottles, etc.)
All basic organic and inorganic chemicals, excluding petrochemicals
Natural rubber
Synthetic rubber
Paper and paperboard products
Fabricated rubber products, excluding tires, hose, belting, and gaskets
Steel wire and wire products
Glass and glass products
Tire cord and tire fabric
Tires and inner tubes
Printing inks
Misc. iron, steel, and ferroalloy ingot, shapes, and forms (excluding castings, forgings, bars, structural, wire, sheet, strip)
Parts and attachments for machinery for chemical processing, glass making, refining, plastics / rubber working, textiles, etc.
Woven textile fabrics, including broadwoven and narrow fabrics
Nonferrous metal and metal-base alloy scrap, excluding aluminum, copper, and precious metal
Artificial and synthetic fibers and filaments, including nylon, polyolefin, polyester, acrylic, and other noncellulosic fibers
Reconstituted wood products, including particleboard, waferboard, hardboard, MDF, and cellulosic fiberboard
INDUSTRY JOBS ANALYZED
Molders and Molding Machine Setters, Operators, and Tenders, Metal and Plastic
Miscellaneous Assemblers and Fabricators
Miscellaneous Production Workers
Laborers and Material Movers, Hand
Forming Machine Setters, Operators, and Tenders, Metal and Plastic
First-Line Supervisors of Production and Operating Workers
Inspectors, Testers, Sorters, Samplers, and Weighers
Extruding, Forming, Pressing, and Compacting Machine Setters, Operators, and Tenders
Machine Tool Cutting Setters, Operators, and Tenders, Metal and Plastic
Industrial Machinery Installation, Repair, and Maintenance Workers
Maintenance and Repair Workers, General
Shipping, Receiving, and Traffic Clerks
Sales Representatives, Wholesale and Manufacturing
Multiple Machine Tool Setters, Operators, and Tenders, Metal and Plastic
Industrial Engineers, Including Health and Safety
General and Operations Managers
Packaging and Filling Machine Operators and Tenders
Industrial Truck and Tractor Operators
Cutting Workers
Customer Service Representatives
About Kentley Insights
All the top consulting firms, banks, accounting firms, private equity firms, and many of the Fortune 1000 depend on Kentley Insights for their in-depth market research needs.

Purchase the 2026 U.S. Plastic & Rubber Products Manufacturing Market Report to unlock the 63 pages of data-rich insights backed by our 100% MoneyBack Guarantee.
Support Contact:
Email us at support@kentleyinsights.com
Call us at 1-800-613-3611